System Status Page
As you might have read about by now, Salesforce.com has made their system status page public. It is located here. I think it is great that they are doing this and it is very interesting to see this information.
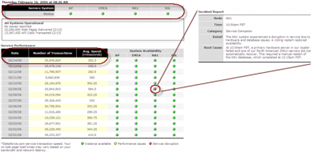
Across the top, you see the current status. Each server (AP, EMEA, NA1 and SSL (used for PE edition only, i think)) is listed and a red/yellow/green status indicator is there telling you the system status. I would expect, should the status be yellow or red, that there would be an explanation of the problem. It will be interesting to see how they handle this during actual outages. Will the explanation be there in real-time or will those be delivered after the fact? Ideally, there will not only be explanation on the problem, but information on which parts of the application are down (API vs. GUI) and the expected time to come back online.
Then they show historical status. As you can see in the picture, clicking on the red status from 02/09 on NA1, they give a detailed explanation of the problem that occurred. Also interesting in the historical section are the number of transactions and avg. speed. It gives some appreciation as to the size of the application and what they are dealing with over there. Kind of makes you wish that NA2, NA3, NA4, etc. all existed for failover purposes.
