Archive for Arrowpointe Products Category Feed

Campaign Member Maps and more (Arrowpointe Maps v1.0.6)

Version 1.0.6 of Arrowpointe Maps was just released. You can read about all the improvements on the Change History page. The changes that most impact user experience and the application’s capabilities are:

  • Campaign Member mapping is now supported. Your subscriptions have been updated to include a new Campaign Member Map Object and Map Page. The Map Page is in Admin Only status so that it not visible to your end users. Once you test it and like it, change the status to Active to deploy it.
  • Customers are now allowed to use their own latitude and longitude values rather than having MapQuest determine the coordinates. To setup your system to use this functionality, edit your Map Objects to specify a field that holds your Latitude and Longitude values.

    When a map is processed, it will look to see if the Latitude and Longitude values are present on the record. If so, those values will be used to plot the record on the map. If not, the address will be geocoded by MapQuest.

  • Added new options for Date and Date-Time Filter Fields:
    • This Quarter
    • Last Quarter
    • Next Quarter
    • This Year
    • LastYear
    • Next Year
    • In The Past
  • Added the ability for users to show or hide the map page query form in order to gain more real estate on the page and use a larger map.
  • Fixed an issue where the Info Window for points on the map would go transparent.
  • Other Usability, Performance & Security Enhancements

NOTE: If you are using Arrowpointe Maps and are confused by these posts about new versions, just know that these updates are happening automatically for you. You do not need to re-download the AppExchange application. Changes to the AppExchange package will be few and far between and those will be communicated very explicitly.

About Arrowpointe Maps

Arrowpointe Maps is an on-demand mapping platform that facilitates a conversation between Salesforce.com & MapQuest allowing for easy deployment of mapping capabilities in your organization and providing end-users a simple means for mapping their data. Arrowpointe Maps is configurable and can be tailored to your organization, so that your users can work with their information in a meaningful way.

The official location for information on Arrowpointe Maps is its product page at http://www.arrowpointe.com/maps. There, you will find answers to the most frequently asked questions, screencasts and links to its AppExchange page.

Comments off comments feed

CRMfusion’s Customer Map

Comments off comments feed

Improved Global Support

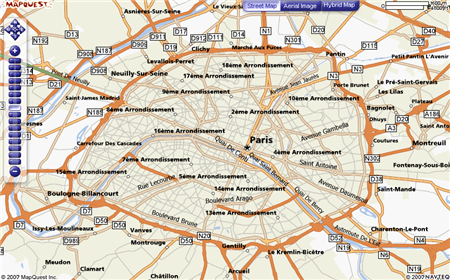
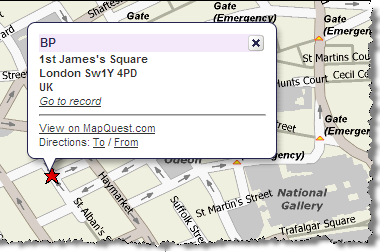
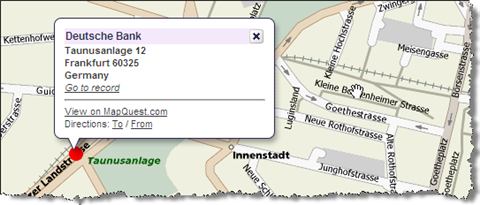
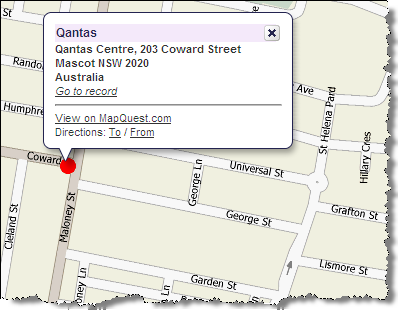
MapQuest made a significant update to their map images last night and greatly improved Arrowpointe Maps‘ ability to support global addresses. The API that Arrowpointe Maps uses was already now caught up with the main MapQuest.com site in terms of geocoding capabilities, but it is now also caught up in terms of map images.

This update from MapQuest “just happened” and requires no changes on your part or ours. Also, be on the lookout for more upcoming improvements to MapQuest’s overall mapping platform (very impressive) that Arrowpointe Maps will reap the benefits of.

arrowpointemaps_paris.png

arrowpointemaps_bp.png

arrowpointemaps_deutsche_bank.png

arrowpointemaps_qantas.png

Comments (1) comments feed

Arrowpointe Maps v1.0.5

Version 1.0.5 of Arrowpointe Maps was just released. You can read about all the improvements on the Change History page. The changes that most impact user experience and the application’s capabilities are:

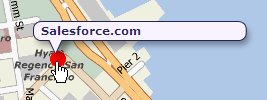
  • Added a mouseover reaction on the map to show the Info Window title when a marker is moused over. This allows a user to see which record is which without opening up each marker.
    arrowpointemaps_poihover.png
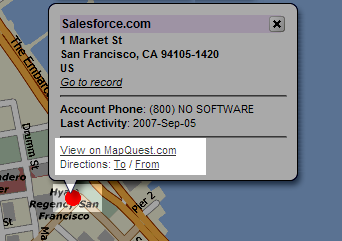
  • Added links to all map marker Info Windows to allow the address to be mapped or used in driving directions on mapquest.com.
    arrowpointemaps_mqlinks.png
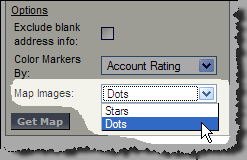
  • Added support for Dots as a map image (see image above). Allows the user to choose between Dots or Stars and it remembers the last selected value for the next map run.
    arrowpointemaps_dotsandstars.png
  • Added “does not contain” as a comparison operator to be used on String map filter fields.
  • Added a “Last 7 Days” and Next 7 Days” option to be used on Date map filter fields.

NOTE: If you are using Arrowpointe Maps and are confused by these posts about new versions, just know that these updates are happening automatically for you. You do not need to re-download the AppExchange application. Changes to the AppExchange package will be few and far between and those will be communicated very explicitly.

About Arrowpointe Maps

Arrowpointe Maps is an on-demand mapping platform that facilitates a conversation between Salesforce.com & MapQuest allowing for easy deployment of mapping capabilities in your organization and providing end-users a simple means for mapping their data. Arrowpointe Maps is configurable and can be tailored to your organization, so that your users can work with their information in a meaningful way.

The official location for information on Arrowpointe Maps is its product page at http://www.arrowpointe.com/maps. There, you will find answers to the most frequently asked questions, screencasts and links to its AppExchange page.

Comments off comments feed

Sidebar Summary

There is an updated post here that explains how to do this with Visualforce instead

I was recently looking at Rave CRM by Entellium and I was inspired by their UI design. I only saw the demo on their website, but they had a lot of really good UI ideas. One of the things I really liked was a quick summary of data counts on the homepage that were very applicable to the end user.

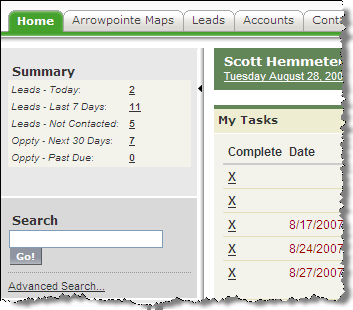
I wanted to see if I could create something similar in Salesforce. Using an s-Control that is shown via an IFRAME on the sidebar, I was able to do it. The end result is like having a bunch of Metric style dashboard components stacked on top of each other. You can see it in action below. Each line shows a record count and the record count is a hyperlink to a View or Report. It’s small, clean and tells the user vital information with quick links to see more. I like the concept.

SidebarSummary.png

How it works

It is all running in an s-Control and uses the AJAX toolkit to talk to Salesforce. The s-Control is in an IFRAME in a homepage component. The s-Control has a function called getCount and you pass getCount the following:

  • Object to Query
  • WHERE clause for the query
  • Label for the returned HTML
  • A URL to let a user drilldown on the result

A call to it looks like this:

theHTML += getCount("Lead", "WHERE IsConverted = False AND CreatedDate = TODAY", "Leads - Today", "/00Q?fcf=00B30000001Qizn");

It uses the object and where clause to do a count() query. It then returns an HTML table row with 2 columns. The first has the label you passed it in italics. The second has the record count of the query as a hyperlink to the URL you passed it. If you don’t pass it a URL, then it shows the record count without a hyperlink.

The s-Control is made up of 2 functions: getCount() and main(). getCount is described above. main() calls getCount once for each metric and then wraps the results in some more HTML. A bit of CSS is sprinkled in to output it nicely on the homepage sidebar. That’s it.

Try It

I uploaded it to the AppExchange to let people try it and improve upon it. It is just a proof of concept. I am using it in my org right now, but it needs to be improved if I will let it stick around. For example, it’d be great to have it cache the data and only run the queries once every 30 minutes because running it can slow the load time a bit. Is anyone up for improving it to meet that requirement?

To make this work for you, you should be familiar with s-Controls. It’s not plug and play. Getting it setup expects you have a working knowledge of this stuff. I kind of hacked it together and wanted to get it out there for other to see. It’s very simple code, but I think it serves a very good purpose. I am interested in what you think.

btnGetApps.gif

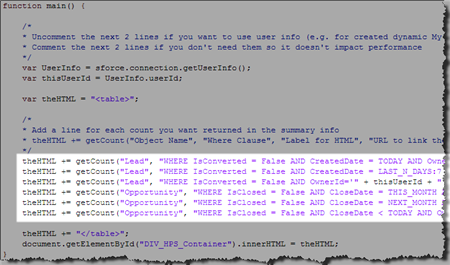
I set it up with some basic queries, but I’d recommend you change them to meet your needs. To change what the queries are, you need to go into the main() function and edit the lines that call the getCount function. You will need a single line of code for each query you want to run.

SidebarSummary_MainFunction.png

If you really want it to work nicely, you should create corresponding Views or Reports and link to those by passing the getCount function the URL of the View or Report.

Once you have your queries all set, you need to add the homepage component. I didn’t package one in the AppExchange package because I have been unable to edit a homepage component that only has an IFRAME in it (WYSIWYG editor bug). I’ve had to delete it and recreate it every time. So you get to do that too!

  1. Create an HTML Area Homepage Component
  2. Choose it to go on the left (narrow) navigation bar
  3. Click the Show HTML checkbox on the WYSIWYG editor
  4. Copy the HTML below and replace IdOfScontrol with the ID of the s-Control in your AppExchange package. You can change the height of the IFRAME too.

    <IFRAME src="/servlet/servlet.Integration?lid=IdOfScontrol&amp;enc=UTF-8&amp;ic=1" frameBorder=0 width="100%" height="150"></IFRAME>

  5. Add the new Homepage Component to your Homepage Layout

Now you should be ready to test it out. Using a tool like Firebug can greatly improve your ability to troubleshoot issues and make enhancements.

Please let me know what you think by posting comments. I am interested in thoughts on the concept, ways to improve it, issues you are having, etc.

Comments (17) comments feed

Next entries » · « Previous entries